AI Demand Forecasting for Every SKU
Most planning tools run one forecasting model across the whole catalog, and it's the wrong model for most products. buffers.ai backtests five models on every SKU's own history, forecasts each one with the model that actually performed best, and turns that forecast into a purchase plan.
Built forDemand planners, supply planners and purchasing teams buying for a central warehouse across a large SKU catalog.
- 5
- Models backtested on every SKU
- 21,600
- Backtests in our public benchmark
- 36.2%
- Best single model's win rate: no model fits all
Demand → Forecast → Purchase plan
- Step 1
Demand
Each SKU's daily sales history. Past promotions and events are measured from it, not entered by hand.
- Step 2
Champion forecast
Five models backtested per SKU; the best performer on WAPE and bias forecasts it.
- Step 3
Purchase plan
The forecast becomes order quantities after lead time, safety stock, MOQs, budget and open commitments.
One model never fits every SKU
A fast-moving basic, a seasonal fashion item and a slow seller with sporadic sales need different models. Instead of assuming one works for everything, buffers.ai measures which one does, product by product.
- 01
Backtest every model
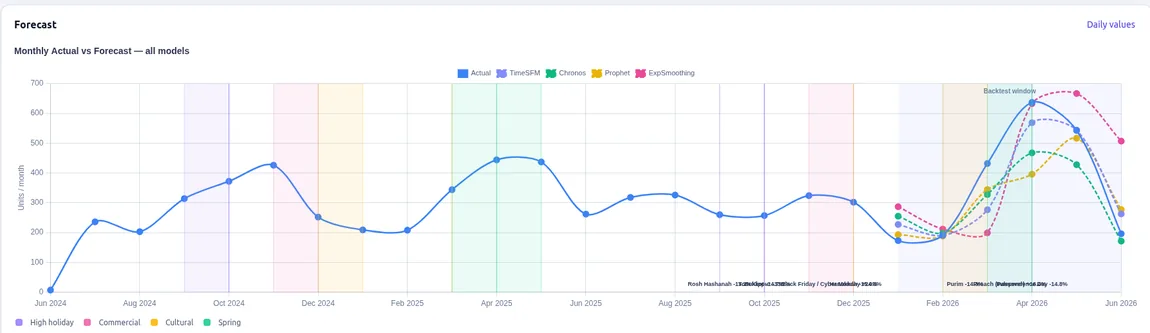
Each SKU's own sales history runs through all five engines over a rolling six-month window, on data none of them has seen.
- 02
Score on WAPE and bias
WAPE measures how far off each forecast ran against total actual demand; bias shows whether it systematically over- or under-forecasts.
- 03
Crown a champion per SKU
The closest fit forecasts that SKU. Champions are re-scored on a rolling basis, so a different model takes over when it starts performing better.
Five engines, one winner per SKU
We don't bet on a single algorithm. All five run on every product, from a foundation model down to a plain average, and the backtest decides.
- Foundation model
TimesFM
Created byGoogle
A time-series foundation model, pre-trained on billions of points, then pointed at your demand.
- Strengths
- Captures nonlinear demand patterns and transfers what it learned from other series, so it performs well with little SKU-specific history.
- Watch out for
- Less interpretable than statistical models, and heavier to run at scale.
Best for: New products, fast-fashion items and categories with irregular or trending demand.
- Gradient-boosted trees
LightGBM
Created byMicrosoft
Trained across the whole catalogue, reading product attributes (color, price, season, style) so similar products inform each other.
- Strengths
- Handles nonlinear relationships and many inputs at once; fast to train and score across a large catalog.
- Watch out for
- Needs enough history to learn reliable relationships between attributes and demand.
Best for: Trending products and large catalogs where similar items share demand patterns.
- Trend + seasonality
Prophet
Created byMeta
Decomposes demand into trend and seasonal waves: sturdy, interpretable, hard to beat.
- Strengths
- Explicit, interpretable seasonality; robust to missing data and outliers; easy to see why it forecasts what it does.
- Watch out for
- Assumes seasonality is fairly regular from year to year.
Best for: Seasonal products with recurring calendar patterns: holiday goods, seasonal apparel, weather-linked categories.
- Holt-Winters family
Exponential Smoothing
Created byBrown, Holt & Winters (1950s)
Classical exponential smoothing, weighting recent sales most heavily: the line every fancier model has to clear to earn its keep.
- Strengths
- Simple, fast and well understood; produces a stable forecast from little data.
- Watch out for
- Struggles with complex, nonlinear shifts in demand.
Best for: Stable-demand staples and steadily seasonal products.
- Day-of-week average
Moving Average
OriginClassical statistics
A plain day-of-week average of recent weeks. No parameters, the simplest yardstick in the field.
- Strengths
- Extremely transparent and hard to overfit; a strong baseline for very stable SKUs.
- Watch out for
- Reacts slowly to genuine shifts in demand and can't model trend.
Best for: Low-volume, low-variance SKUs where simplicity beats complexity.
From backtest to purchase order
The champion forecast is the start. Promotions, new products and supply constraints are handled before it reaches a purchase recommendation.
Backtest & Champion Selection
Race 5 forecasting engines, crown the best fit per SKU
Every SKU's sales history runs through five forecasting engines — TimesFM (Google), LightGBM (Microsoft), Prophet (Meta), Exponential Smoothing, and Moving Average — backtested over a rolling six-month window on data none of them has seen. Each model is scored on WAPE, bias, safety stock, and service level, and the closest fit is crowned the champion for that SKU.
- Function
- 5-engine backtest: TimesFM, LightGBM, Prophet, Exponential Smoothing, Moving Average
- Optimizes for
- Forecast accuracy per SKU, scored on WAPE, bias, safety stock, service level
Blended Demand Build
Build the demand signal from the champion model
Once a champion algorithm is selected per SKU, buffers.ai builds a blended demand forecast from its output — the single demand number that feeds every downstream buffer, replenishment, and supply calculation.
- Function
- Demand signal construction from each SKU's champion forecasting model
- Optimizes for
- Forecast accuracy feeding the supply calculation
Supply Calculation
Turn the demand forecast into a purchase order
Converts the blended demand forecast into a purchase recommendation, accounting for lead time, safety stock, minimum order quantities, budget limits, and open commitments.
- Function
- Lead time, safety stock, minimum order quantity, budget, and commitments applied to the blended forecast
- Optimizes for
- Right-sized purchase orders within budget and commitment constraints
Promotion Uplift
Measure each promotion's real lift, then forecast the next one with it
Every past promotion is measured on each SKU's own sales: average daily demand during the event against a clean baseline of the four weeks before and after it, with other event days left out and repeat runs of the same event pooled. A future promotion points at a comparable past one and inherits its measured lift, so a brand-new promo is forecast from real history instead of a guess. Prophet reads the events directly as holidays; the other engines get the measured lift applied to the forecast on the promotion days. One-off events nobody planned are smoothed out of the training data so they don't skew the model.
Measured: last spring's 30%-off sale
Applied: this summer's sale, same 7 days
- Measured lift
- 82 / 50 − 1 = +64%
- Applied to the forecast
- 55 × 1.64 = 90.2/day
- Over the 7 days
- 385 → 631 units
- Function
- Per-SKU promotion lift measured from history and applied to future promotion days
- Optimizes for
- Forecast accuracy through promotions, without one-off spikes distorting the baseline
Cold-Start Forecast
Forecast a brand-new SKU before it has sold a single unit
The five forecasting engines need a SKU's own history, so a new item would otherwise get no forecast at all. Instead it is matched to products that share its attributes, starting with the most specific group that has at least eight of them and widening only when it has to. Its demand level is the median of that group, shaped by the group's own weekday, month-of-year, and launch-ramp patterns. As the new SKU starts selling, its own sales take a growing share of the forecast.
Find similar products (needs at least 8)
- Running sneakers, $90-1305 SKUs, too few
- Sneakers23 SKUs, used
- Footwear140 SKUs, not needed
Blend with its own sales so far
- Weight on its own sales
- 14 / (14 + 21) = 40%
- Forecast level
- 0.4 × 6.0 + 0.6 × 4.2 = 4.92/day
- Before its first sale
- 4.2/day, from similar products alone
- Function
- Analog-based forecast for new and thin-history SKUs, blended with their own sales as they accrue
- Optimizes for
- A usable launch forecast and PO quantity from day one
Family Forecast & Size Curve
Forecast the style family, then split it back down to every size
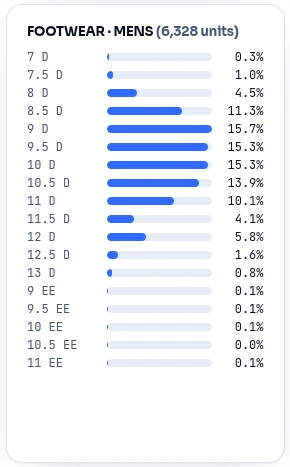
In footwear and apparel a single SKU (one style, colour and size) often sells only a couple of units a season, far too few for any model to forecast reliably. So buffers.ai forecasts one level up, at the style family, where demand is strong enough for the backtest and champion selection to work. That family forecast is then split back down to the SKUs you actually order. Colourways get their share from recent sales, so a new colourway or version takes over from the old one. Sizes and widths get their share from a size curve: the size mix is mostly a property of the store's customers, not of the shoe, so it is learned across every family in the same category and gender, and each family's own sales nudge it in proportion to how much that family has sold. Each size then orders a service-level quantity of its expected demand instead of a plain round, so a size expected to sell 0.4 units isn't silently dropped.
- Family forecast
Forecast the style family, where there is enough demand to read
- × Colourway share
Split by what each colourway sold recently
- × Size curve
Split by the size and width mix of the store's customers
- = SKU order
Each size rounded up to a service-level quantity, not a plain round
- Function
- Family-level forecast split to SKUs by colourway share and a pooled size-and-width curve
- Optimizes for
- A reliable forecast for thin, size-run SKUs and a size-by-size order quantity
Forecast every SKU with the model that fits it
Champion selection, WAPE and bias per SKU, and a supply calculation that turns the forecast into purchase quantities.
Frequently Asked Questions
One platform, three modules
Each module is licensed on its own. Start with the one that solves today's problem and add the others when you need them.
- You're hereForecastingFive models backtested per SKU. The champion forecast wins.
- Monthly Buy PlanBuy PlanA 12-month category plan that lands inside your buying budget.Explore Buy Plan
- AI Inventory ReplenishmentReplenishmentDaily store orders and safety stock, recalculated automatically.Explore Replenishment